Interactive Nees Schotter Computer Art Tutorial
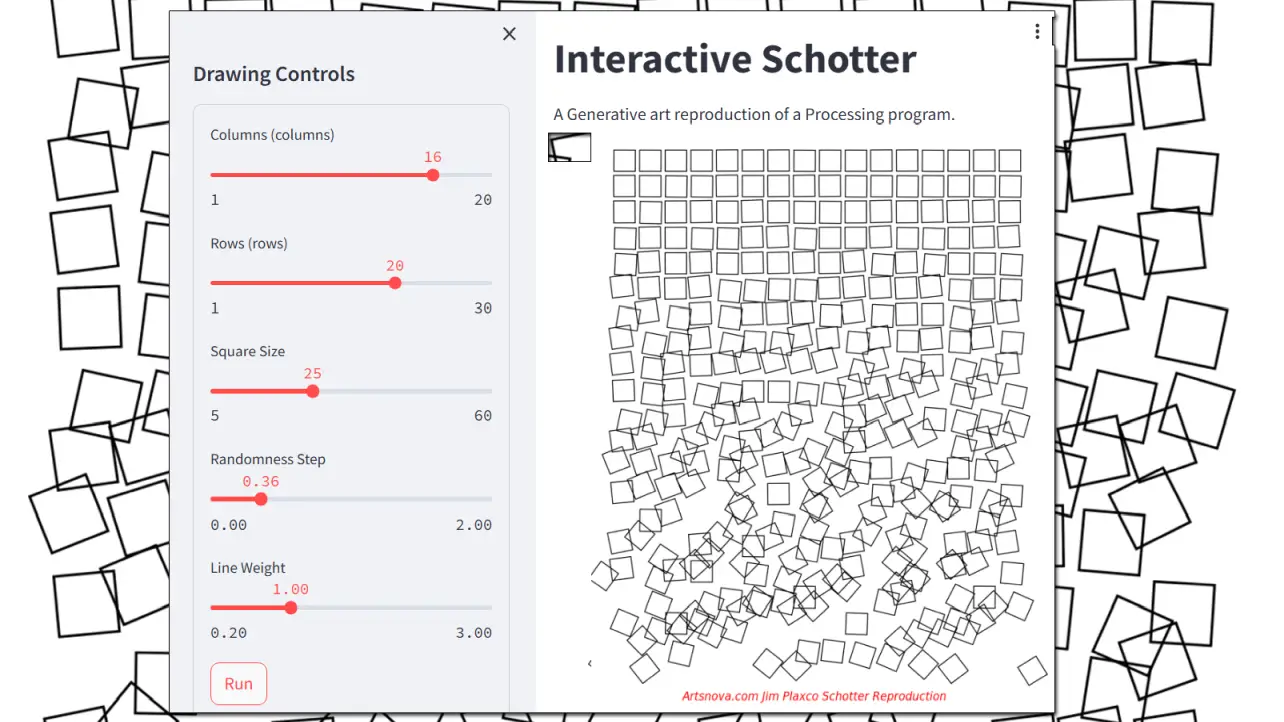
Some years ago I wrote a tutorial on how to use the Processing programming language to write a program that would recreate a famous work of early computer art. Titled Schotter (Gravel in German), that work of algorithmic art was a plotter drawing created by Georg Nees circa 1965. As a part of the tutorial, I included my program's source code so that anyone could experiment with the program's parameters and how they impacted the artwork that was created. What made this work of algorithmic art fascinating to me was the progression from order to disorder via the random factors that were used and the way in which they were used. You can read my original tutorial at Georg Nees, Processing, and a Schotter Tutorial.
I recently began working with Streamlit, a framework for running Python programs as web apps. I was doing this as a part of my work on building a space station cost simulator, done in conjunction with a commercial space business talk I am to give at an upcoming space conference. While working on that rather complex software project, I thought it would be a good idea to first deploy a simpler Python web app that met my core requirements, which were:
- the source code should not be publicly accessible
- the web app would only run when accessed from the specified host domain
- the service would be of minimal cost
Unfortunately, to deploy the app to either Streamlit Community Cloud or Hugging Face Spaces for free would require that the source code be public so those were not options. I initially decided to host the web app myself, which meant adding the appropriate configuration parameters to my webserver and creating the necessary associated configurations. Note that these configuration options are not available to folks whose website is running in a shared hosting environment. Given the configuration complexity to run the app from my own server, I decided to give Render.com a try, which is where the web app is currently running.
While the purpose of the original Schotter tutorial was to provide creative coders with a starting point to create their own interpretations of Schotter, the purpose of this tutorial is to provide users with access to key parameters with which they can create their own versions of Schotter in real time and observe the variations in the artworks that are created as the parameters are changed. This is your opportunity to experiment. Feel free to right-click on the image that the app generates and save it to your computer.
Running the Schotter Web App
The Schotter web app runs automatically using the default parameter values when the page is first loaded. Note that it can take some minutes for the web app to start, depending on when it was last accessed. When the application is in the process of loading, the canvas will appear black and there will be an "APPLICATION LOADING" message in the lower right corner of the canvas. When loaded and running, the app will look like the following image:
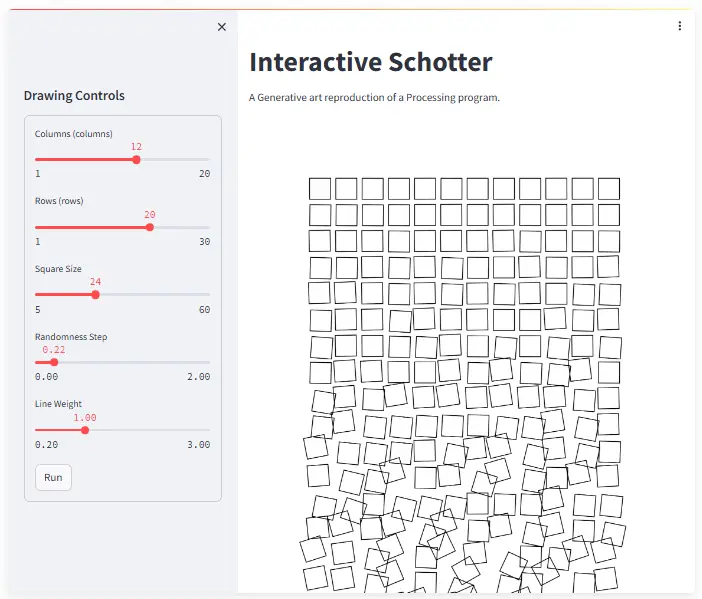
To initiate a new run of the program, change one or more of the slider values in the sidebar and then click the 'Run' button. This will kick off the web app and produce a new artwork that allows you to see how the values that you altered impact the image that is generated. While the app is executing (processing your request), the upper right hand corner of the app's window will display a small 'RUNNING' message.
Caveat: if you do not see the sidebar, the gray column on the left side of the canvas labeled Drawing Controls, that is a result of the sidebar having been collapsed because of the width of your screen. The sidebar may be opened by clicking on the '>' character that appears in the top left corner of the app's canvas. Similarly, the sidebar may be closed by clicking on the '<' character that is displayed when the sidebar is present.
The User Controllable Program Parameters
The following table identifies the parameters that you the user can control within the bounds given.
| Variable | Minimum Value | Maximum Value | Purpose |
| Columns | 1 | 20 | Controls the number of columns drawn. |
| Rows | 1 | 30 | Controls the number of rows drawn. |
| Square Size | 5 | 60 | Controls the size of the squares drawn. |
| Randomness Step | 0.0 | 2.0 | Sets the degree of randomness (this is the key variable) used to build the array of squares. |
| Line Weight | 0.2 | 3.0 | Sets the thickness of the lines being drawn for aesthetic impact. |
Be aware that if you specify a large number of rows, the size of the canvas will adjust and you will have to use the canvas' own vertical scroll bar to view the lower portion of the artwork.
I hope you enjoy your adventure with Schotter and that it inspires you to investigate other examples of early computer art.